On the basis of its fiscal solvency in five separate categories, Maryland ranks 41st among the US states and Puerto Rico for its fiscal health. On a cash basis, Maryland has between 0.51 and 1.52 times the cash needed to cover short-term liabilities. Revenues cover 98 percent of expenses, producing an operating deficit of $122 per capita. On a long-run basis, Maryland has a negative net asset ratio of ?0.19, pointing to the use of debt financing. Total liabilities are 63 percent of total assets, resulting in a per capita long-term liability of $4,266. Total debt is $17.21 billion. Unfunded pension liabilities are $74.77 billion on a guaranteed-to-be-paid basis, and other postemployment benefits (OPEB) add $8.71 billion. These three liabilities are equal to 31 percent of total state personal income.
Key Terms
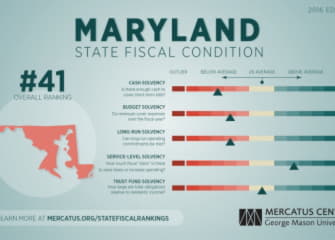
- Cash solvency measures whether a state has enough cash to cover its short-term bills, which include accounts payable, vouchers, warrants, and short-term debt. (Maryland ranks 43rd.)
- Budget solvency measures whether a state can cover its fiscal year spending using current revenues. Did it run a shortfall during the year? (Maryland ranks 45th.)
- Long-run solvency measures whether a state has a hedge against large long-term liabilities. Are enough assets available to cushion the state from potential shocks or long-term fiscal risks? (Maryland ranks 43rd.)
- Service-level solvency measures how high taxes, revenues, and spending are when compared to state personal income. Do states have enough “fiscal slack”? If spending commitments demand more revenues, are states in a good position to increase taxes without harming the economy? Is spending high or low relative to the tax base? (Maryland ranks 16th.)
- Trust fund solvency measures how much debt a state has. How large are unfunded pension liabilities, OPEB liabilities, and state debt compared to the state personal income? (Maryland ranks 18th.)
For a complete explanation of the methodology used to calculate Maryland’s fiscal health rankings, see Eileen Norcross and Olivia Gonzalez, “Ranking the States by Fiscal Condition,” 2016 ed. (Mercatus Research, Mercatus Center at George Mason University, Arlington, VA, June 2016).

